Identify the type of graph. = 1 +
= 1 + 
A. The graph is an ellipse with foci on the y-axis.
B. The graph is a hyperbola that opens to the right and left.
C. The graph is a hyperbola that opens upward and downward.
D. The graph is an ellipse with foci on the x-axis.
Answer: B
You might also like to view...
Find the indicated trigonometric function, given that ? is an angle in standard position with the terminal side passing through the given point.(-5, 3); Find sec ?.
A. - 
B. 
C. 
D. 
Simplify using order of operations.
A. 8 B. 10 C. 4 D. -8
Solve the application involving the slope of a line.Recently, a stock split and the value per share increased. The stock was valued at $11 per share 3 days after the stock split and at $35 per share 11 days after the split. The equation  models the relationship between the stock's value, V , in dollars, and the number of days, t , since the stock split. Find the slope and give its meaning.
A. m = -3; During this period, the value of the stock decreased at the rate of $3 per day. B. m = 2; During this period, the value of the stock increased at the rate of $2 per day. C. m = 3; During this period, the value of the stock increased at the rate of $3 per day. D. m = -2; During this period, the value of the stock decreased at the rate of $2 per day.
Solve the problem.The paired data below consist of the temperatures on randomly chosen days and the amount a certain kind of plant grew (in millimeters). Find the equation of the least-squares regression line that models the data.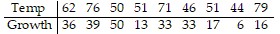
A. y ? -14.6 - 0.211x B. y ? 14.6 + 0.211x C. y ? 7.30 - 0.112x D. y ? 7.30 + 0.122x