Subtract.-9.7 - 12.1
A. 2.4
B. -2.4
C. 21.8
D. -21.8
Answer: D
You might also like to view...
Provide an appropriate response. Shortly before a mayoral election, a market research firm took a poll to find out which candidate people were planning to vote for. The results are shown below. 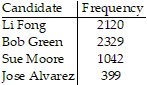 You wish to construct a graph to represent the data. It should be easy to see from your graph which candidate is in the lead. Which graph would be more useful, a bar graph or a pie chart? Explain your thinking.
What will be an ideal response?
Provide an appropriate response.The deviation from the mean can be shown by the standard deviation.
A. True B. False
Evaluate the expression.(f ? f)(6) when f(x) = 4x - 1 and g(x) = 4x2 - 5
A. 23 B. 91 C. 101 D. 19
Simplify. Your answer should be in lowest terms. -
- 
A. 
B. 28
C. 
D. 