Use a graphing utility to graph the function over the indicated interval and approximate any local maxima and local minima. Determine where the function is increasing and where it is decreasing. If necessary, round answers to two decimal places.f(x) = -0.3x3 + 0.2x2 + 4x - 5; (-4, 5)
What will be an ideal response?
local maximum at (2.34, 1.61)
local minimum at (-1.9, -9.82)
increasing on (-1.9, 2.34)
decreasing on (-4, -1.9) and (2.34, 5)
You might also like to view...
Solve the problem.At a local zoo, adult visitors must pay $3 and children pay $1. On one day, the zoo collected a total of $730. If the zoo had 390 visitors that day, how many adults and how many children attended?
A. 170 adults and 220 children B. 182 adults and 208 children C. 220 adults and 170 children D. 110 adults and 280 children
Work the application and answer with a complete sentence.A rectangular plot of land measures 90 feet by 170 feet. Find its area.
A. The area of the plot is 260 square feet. B. The area of the plot is 15,300 square feet. C. The area of the plot is 520 square feet. D. The area of the plot is 1530 square feet.
Solve the problem. The following table shows the number of adults in a certain city who approve of the mayor's performance in various years. It also gives the total number of adults in the city in the same years. 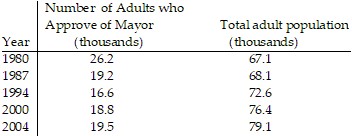 Let p be the percentage of adults in the city who approve of the mayor's performance in the year that is t years since 1980. A reasonable model of the situation is: p =
  Use this model to estimate when 33% of adults in the city will approve of the mayor's performance.
A. 2010 B. 2011 C. 2013 D. 2015
Use Bayes' rule to find the indicated probability.Quality Motors has three plants. Plant 1 produces 35% of the car output, plant 2 produces 20% and plant 3 produces the remaining 45%. One percent of the output of plant 1 is defective, 1.8% of the output of plant 2 is defective and 2% of the output of plant 3 is defective. The annual total production of Quality Motors is 1,000,000 cars. A car chosen at random from the annual output and is found defection. What is the probability that it came from plant 2?
A. 0.35 B. 0.559 C. 0.224 D. 0.217