Refer to the information provided in Table 36.2 below to answer the question(s) that follow. Table 36.2 PointAggregate Income (Y)Aggregate Consumption (C) A 10 14 B 20 23 C 30 25 D 40 26 E 50 34 F 60 39The data in the table was used to estimate the following consumption function: C = 12 + 0.4YRefer to Table 36.2. The error for point A is equal to
A. -3.
B. -2.
C. +2.
D. +3.
Answer: C
You might also like to view...
As more and more businesses accept credit cards, the
A) demand for money decreases. B) supply of money decreases. C) quantity of money demanded decreases. D) demand for money increases. E) quantity of money demanded increases.
You have just read that the Federal Reserve has increased the money supply to avoid a recession. For a given price level, you would expect the LM curve to
A) shift up and to the left as the real money supply falls. B) shift up and to the left as the real money supply rises. C) shift down and to the right as the real money supply falls. D) shift down and to the right as the real money supply rises.
When the price of home delivered pizza falls, the demand Question 5 options:
A. for frozen pizza decreases. B. curve for home delivered pizza shifts leftward. C. curve for frozen pizza shifts rightward. D. for frozen pizza increases.
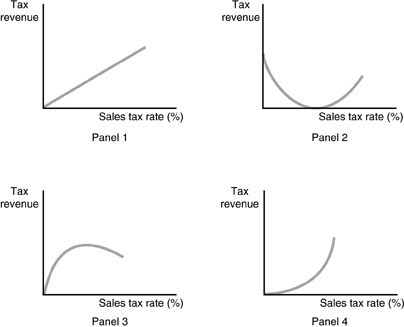 Refer to the above figures. Which panel represents the expected relationship between tax revenue and the sales tax rate if dynamic tax analysis is used?
A. Panel 1 B. Panel 2 C. Panel 3 D. Panel 4