Complete the graph by shading the correct region.y < 4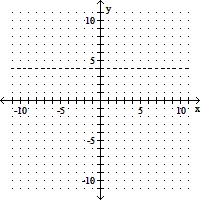
A. 
B. 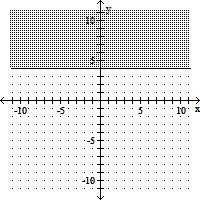
C. 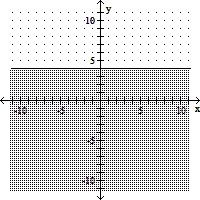
D. 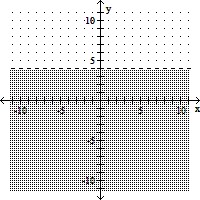
Answer: D
Mathematics
You might also like to view...
Find the limit. ln (z
ln (z )
)
A. ln 100
B. ln 10
C. ln 
D. 0
Mathematics
Solve.x2 - 16 = 15x
A. 1, -16 B. -1, 16 C. -4, -4 D. -4, 4
Mathematics
Add.-32 + (-39)
A. 71 B. -7 C. 7 D. -71
Mathematics
Describe the distributions with a pie chart.The following figures give the economic distribution for 5,000 people who live in a certain county.PoorMiddle IncomeRich1,500?3,000?500
A. 
B. 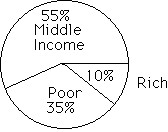
Mathematics