Exhibit 3-3 Demand curves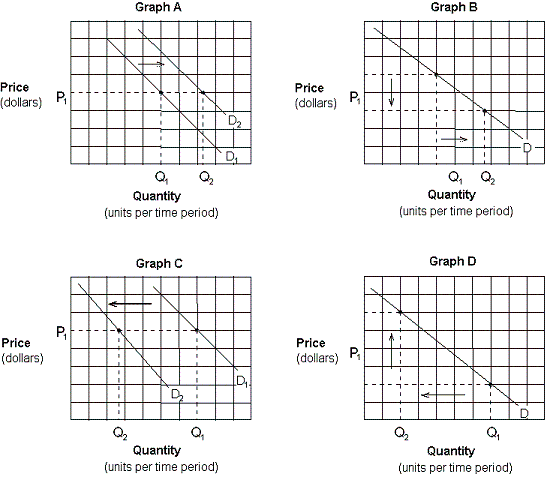
Assume that crackers and soup are complementary goods. Which of the graphs in Exhibit 3-3 depicts the effect of a promotional discount that decreases the price of crackers on the demand for soup?
A. Graph A.
B. Graph B.
C. Graph C.
D. Graph D.
Answer: A
You might also like to view...
According to the above table, what is the absolute price elasticity of demand when price rises from $5.50 to $6?
A) 4.00 B) 2.23 C) 1.21 D) 0.50
A college student decides to spend the afternoon watching three movies rented from Red Box. The cost of each movie is $1. The student was willing to pay $4 to rent each of the first two movies and $2 to rent the third movie. What was the marginal benefit received by the student when renting the 1st movie?
A. $4 B. $8 C. $1 D. $2
The management of Local Cinema has estimated the monthly demand for tickets to be ln Q = 22,328 ? 0.41 ln P + 0.5 ln M ? 0.33 ln A + 100 ln PDVD, where Q = quantity of tickets demanded, P = price per ticket, M = income, A = advertising outlay, and PDVD = price of a DVD rental. It is known that P = $5.50, M = $9,000, A = $900, and PDVD = $3.00. Determine the own price elasticity of demand for movie tickets.
A. ?0.29 B. ?0.39 C. ?0.41 D. ?0.32
Refer to the diagram. Rational expectations theory says that a fully anticipated decrease in aggregate demand from AD 2 to AD 1 will:
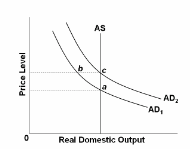
A. move the economy from a to b to c.
B. shift the AS curve to the left.
C. move the economy from c to a new equilibrium at b.
D. move the economy directly from c to a.