Explain carefully the relationship between a confidence interval, a one-sided hypothesis test, and a two-sided hypothesis test. What is the unit of measurement of the t-statistic?
What will be an ideal response?
Answer: In the case of a two-sided hypothesis test, the relationship between the t-statistic and the confidence interval is straightforward. The t-statistic calculates the distance between the estimate and the hypothesized value in standard deviations. If the distance is larger than 1.96 (size of the test: 5%), then the distance is large enough to reject the null hypothesis. The confidence interval adds and subtracts 1.96 standard deviations in this case, and asks whether or not the hypothesized value is contained within the confidence interval. Hence the two concepts resemble the two sides of a coin. They are simply different ways to look at the same problem. In the case of the one-sided test, the relationship is more complex. Since you are looking at a one-sided alternative, it does not really make sense to construct a confidence interval. However, the confidence interval results in the same conclusion as the t-test if the critical value from the standard normal distribution is appropriately adjusted, e.g. to 10% rather than 5%. The unit of measurement of the t-statistic is standard deviations.
You might also like to view...
Joe is the owner of the 7-11 Mini Mart, Sam is the owner of the SuperAmerica Mini Mart, and together they are the only two gas stations in town. Currently, they both charge $3 per gallon, and each earns a profit of $1,000. If Joe cuts his price to $2.90 and Sam continues to charge $3, then Joe's profit will be $1,350, and Sam's profit will be $500. Similarly, if Sam cuts his price to $2.90 and Joe continues to charge $3, then Sam's profit will be $1,350, and Joe's profit will be $500. If Sam and Joe both cut their price to $2.90, then they will each earn a profit of $900. You may find it easier to answer the following questions if you fill in the payoff matrix below. 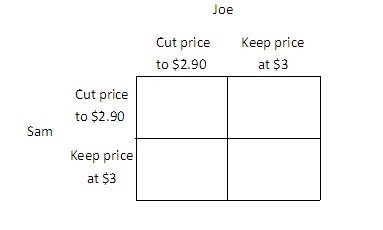
width="383" />If both players choose their dominated strategy they will each earn ________, and if both players choose their dominant strategy they will each earn ________. A. $900; $1000 B. $1000; $900 C. $500; $1350 D. $900; $1350
The labor force participation rate shows the percentage of
A) people not working, but who want to work. B) people who are not actively participating in meaningful economic activity. C) new entrants into the labor force. D) non-institutionalized working-age people who are actually working or seeking employment.
If both the supply of labor and the demand for labor increase, then
A) potential GDP decreases. B) potential GDP increases. C) full employment decreases. D) the impact on potential GDP is uncertain
The value of the consumer price index increased from 140 to 147 during 2006 . Nathan opened a bank account at the beginning of 2006, and at the end of 2006 his account balance was $12,840 . The purchasing power of Nathan's account increased by 2 percent during the year. We can conclude that Nathan opened his account with a deposit of $11,500 at the beginning of 2006
a. True b. False Indicate whether the statement is true or false