Add or subtract. Write the answer in lowest terms. +
+  -
- 
A. 
B. 
C. 
D. 
Answer: C
Mathematics
You might also like to view...
Simplify.
A. 17
B. 
C. Not real number
D. 
Mathematics
The data in the figure below represents the annual salaries of 120 professional mathematicians.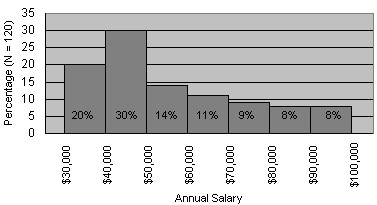 The kind of graph shown above is called
A. a frequency table. B. a box plot. C. a bar graph. D. a histogram. E. none of these
Mathematics
Show the solution set of each inequality on a number line.-6 ? x < -2![]()
A. ![]()
B. ![]()
C. ![]()
D. ![]()
Mathematics
Solve the problem.What is the probability that the arrow will land on an odd number? Assume that all sectors have equal area.
A. 
B. 
C. 0
D. 1
Mathematics