(a) Plot the grain-size distribution curve for this sample. (b) Determine D10, D30, and D60. (c) Calculate the uniformity coefficient, Cu. (d) Calculate the coefficient of gradation, Cc.
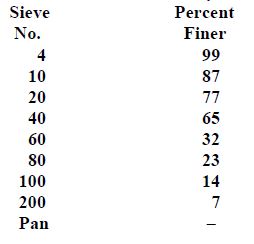
Following are the results of a sieve analysis:
What will be an ideal response?
(a) The grain-size distribution curve is shown as follows,
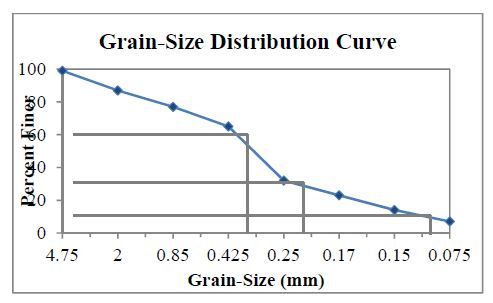
(b) From the preceding figure, D10 = 0.113 mm
D30 = 0.237 mm
D60 = 0.396 mm
(c) The coefficient of uniformity can be calculated using Equation 17.19:
Cu = (D60 / D10)
Cu = 0.396 / 0.113
Cu = 3.50
(d) The coefficient of curvature can be calculated using Equation 17.20:
Cc = D302 / (D60)(D10)
Cc = (0.237)2 / (0.396)(0.113)
Cc = 1.26
You might also like to view...
How are the overload contacts connected in the logic circuit described in this chapter?
What will be an ideal response?
A process technician can reduce fouling in a heat exchanger by: Circle all that apply!
a. increasing fluid velocity b. decreasing fluid velocity c. lowering the temperature d. increasing the temperature e. removing inhibitors f. adding inhibitors
What term is used to describe the ability of the fuel to vaporize?
What will be an ideal response?
All workers are covered under the workers’ compensation laws.