Based on the graph in Figure 45-1, which of the following statements is true?
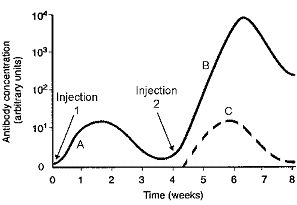
a. The primary response to the initial injection subsided after seven weeks.
b. The primary response to the initial injection peaked at 102 antibody units.
c. The primary response to the initial injection was faster, but not as intense as the secondary
response.
d. The secondary response to the initial antigen was both faster and more intense than the
primary response.
e. The primary and secondary responses to the initial antigen were about equal.
D
You might also like to view...
Which trophic level would be best represented by a leopard seal?
a. decomposer b. detritivore c. primary consumer d. primary producer e. quaternary consumer
A(n) _____________________ is a term given to a macromolecule (large molecule) made up of individual subunits
Fill in the blank(s) with the appropriate word(s).
Which antimicrobial does not inhibit cell wall synthesis?
A. Gentamicin B. Carbapenems C. Cephalosporins D. Vancomycin E. Penicillins
Adaptive immunity is ________, while innate immunity is ________
a. specific / non-specific b. non-specific / specific c. slower / faster d. born / developed