In the figure above, D0 is the demand for labor curve. Imposing a minimum wage of $3 per hour will
A) have no effect on the market.
B) result in unemployment.
C) result in a labor shortage.
D) immediately shift the demand curve to D1.
A
You might also like to view...
Use the following table to answer this question, which provides information on the production of a product that requires one variable input.InputTotal Product00102002060030720408205090060980The average product of the 30th input item is
A. 200. B. 120. C. 24. D. 12.
Refer to Figure 11.4. Which diagram illustrates the effect of a decrease in government spending?
A) A B) B C) C D) D
If the number of unemployed workers in an economy is 4 million, and the size of the labor force in the economy is 16 million, the unemployment rate in the economy is:
A) 8 percent. B) 4 percent. C) 30 percent. D) 25 percent.
According to the graph shown, if a firm is producing at Q2:
This graph represents the cost and revenue curves of a firm in a perfectly competitive market.
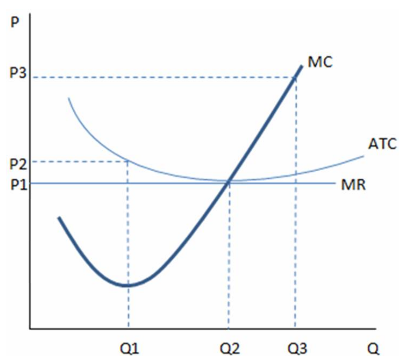
A. profits are being maximized.
B. average total costs are minimized.
C. it is producing at an efficient scale.
D. All of these are true.