A contour map illustrates a cause-and-effect relationship among three variables.
Answer the following statement true (T) or false (F)
False
You might also like to view...
The self-correcting tendency of the economy means that rising inflation eventually eliminates:
A. unemployment. B. exogenous spending. C. recessionary gaps. D. expansionary gaps.
Exhibit 4-8 Demand and supply curves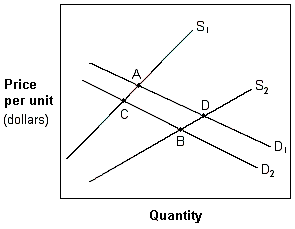 In Exhibit 4-8, a movement from A to C is best described as a(n):
A. increase in the quantity supplied and a decrease in the demand. B. decrease in the quantity supplied and a decrease in demand. C. decrease in the quantity supplied and an increase in demand. D. decrease in the quantity demanded and a decrease in supply.
If policymakers attempt to offset a favorable inflation shock with monetary ________, the resulting long-run equilibrium will be at ________ inflation rate compared to allowing the self-correcting mechanism return the economy to potential output.
A. tightening; a lower B. tightening; a higher C. easing; a lower D. easing; a higher
Houston trades his golf club for Austin's tennis racket, and both are happy with the exchange. This is an example of Pareto efficiency.
Answer the following statement true (T) or false (F)