On the graph above, if output is falling, while the quantity demanded is rising, the economy may be at a point on ________
A) the aggregate supply curve above the aggregate demand curve
B) the aggregate supply curve below the aggregate demand curve
C) the aggregate demand curve above the aggregate supply curve
D) the aggregate demand curve below the aggregate supply curve
E) none of the above
A
You might also like to view...
The Herfindahl-Hirschman Index is a measure of market power that focuses on:
A) the ratio of the price of a firm's product to the price elasticity of demand for the product. B) the share of the market controlled by the X largest firms in the market. C) the sum of the squares of the market share of each firm in an industry. D) the difference between a firm's product price and its marginal costs of production.
According to the graph shown, the profit being earned by this monopolist is:
This graph shows the cost and revenue curves faced by a monopoly.
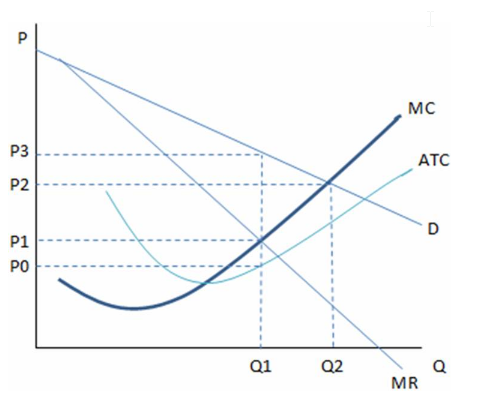
A. (P3 P0) ×Q1
B. (P3 P1) × Q1
C. (P1 P0) × Q1
D. (P3 P0)/Q1
A unit of account is the function of money when used as a yardstick to post prices and record debts.
Answer the following statement true (T) or false (F)
Which of the following is exempt from antitrust laws?
A. professional football B. airlines C. petroleum companies D. hospitals