Aggregate-demand aggregate supply model with AD shifted to the right. In the figure above suppose the economy is initially at point A. The movement of the economy to point B as shown in the graph illustrates the effect of which of the following policy actions by the Federal Reserve?
a. a decrease in income taxes
b. an increase in the required reserve ratio
c. an open market purchase of Treasury bills
d. an open market sale of Treasury bills
c. an open market purchase of Treasury bills
You might also like to view...
In the IS model, assuming that the real interest rate does not change, an increase in ________ leads to an increase in equilibrium saving by households
A) autonomous consumption B) taxes C) financial frictions D) all of the above E) none of the above
Which of the following statements about the distribution of physicians among specialties is true in the United States?
a. The majority of physicians specialize in general/family practice. b. There are twice as many generalists as there are specialists. c. There are twice as many specialists as there are generalists. d. The specialty distribution in the U.S. is similar to that of the rest of the world. e. None of the above.
Which of the following is an accurate statement about a theory?
a. It is accepted as being true for all time. b. It has a broader scope than a hypothesis. c. It has little relation with the real world. d. It is tentatively accepted as being accurate.
Using Figure 1 above, if the aggregate demand curve shifts from AD2 to AD3 the result in the long run would be: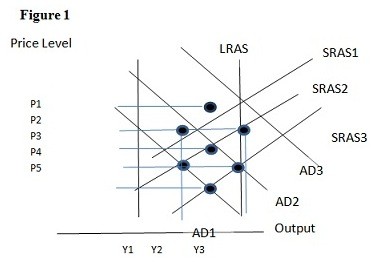
A. P2 and Y2. B. P1 and Y2. C. P4 and Y2. D. P1 and Y1.