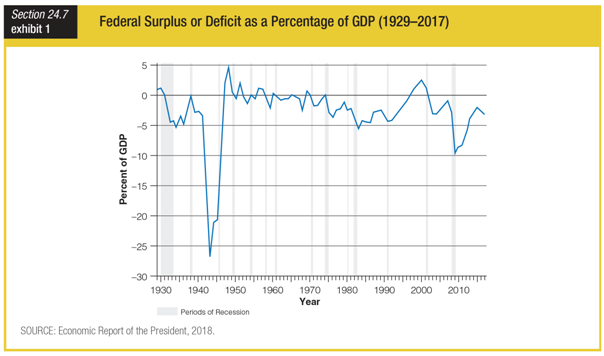
Based on this graph, the year with the biggest deficit took place in the ______.

a. 1940s
b. 1970s
c. 1990s
d. 2000s
a. 1940s
You might also like to view...
Trade deficits always lead to future decreases in consumption if the trade deficits
A) support current investment. B) support current consumption. C) require borrowing from abroad. D) support either current investment or current consumption.
Which of the following is most likely to be a fixed resource for Paul's Country Fresh Pies, Inc?
a. berries b. flour c. bakers d. eggs e. ovens
The less the bend (or arc), or more linear the utility function is, the ________ risk averse the person is.
Fill in the blank(s) with the appropriate word(s).
A ____________ curve graphically shows the? trade-off that occurs when more of one output is obtained at the sacrifice of another. This curve is a graphical representation? of, among other? things, opportunity cost.
Fill in the blank(s) with the appropriate word(s).