In the above figure, what is the marginal cost of the 4th pizza?
A) $0
B) $4
C) $9
D) $36
E) 4 pizzas
C
You might also like to view...
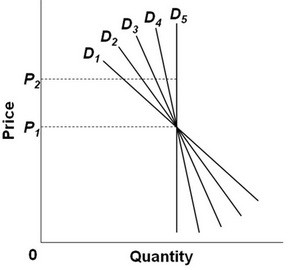 Refer to the figure above. Which demand curve above is relatively more elastic between P1 and P2?
A. D1 B. D2 C. D3 D. D4
If prices in the current year are higher on average than in the base year, real GDP in the current year ________ nominal GDP in the current year.
A. could be greater than or less than B. is less than C. is equal to D. is greater than
As cities prospered and per-capita incomes increased, the demand for bus travel diminished. This suggests that:
A. cities could raise revenue by increasing bus fares. B. the demand for bus travel is price elastic. C. bus travel and automobile travel are complements. D. bus travel is an inferior good.
Refer to the graph below, showing the long-run supply and demand curves in a purely competitive market. We know that when this market reaches equilibrium, the marginal:
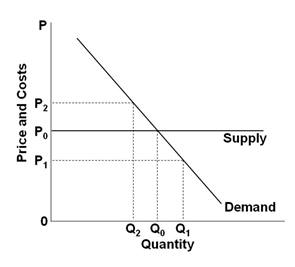
A. Cost equals marginal benefit
B. Benefit exceeds marginal cost
C. Cost exceeds marginal benefit
D. Cost equals zero