Assume the graph shown represents Dawn's budget constraint. If Dawn's income to spend on these two items increased and Dawn spends all her income on these two goods, then Dawn's total utility from consuming these two goods:

A. will likely go up, since she can afford more of both goods now.
B. will likely go down, since her marginal utility of additional items decreases the more she consumes.
C. will likely go down, since she is probably sick of these two things already.
D. will likely go up, since her marginal utility of additional items increases the more she consumes.
A. will likely go up, since she can afford more of both goods now.
You might also like to view...
If the wages of loggers went up, the supply of logs would:
a. fall, thereby shifting to the right. b. fall, thereby shifting to the left. c. rise, thereby shifting to the right. d. rise, thereby shifting to the left.
Which of the following periods was not characterized by inflation in the U.S. economic history?
a. 1917–1920 b. 1929–1933 c. 1947 d. 1978–1980 e. 1980–1989
This graph depicts a tax being imposed, causing demand to shift from D1 to D2. The amount of the tax imposed in the graph shown is equal to:
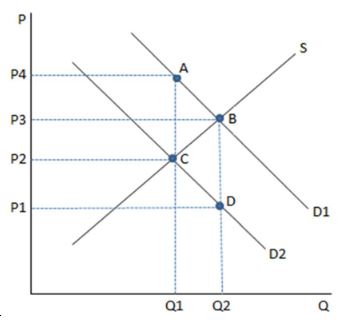
A. (P1 P3).
B. (P2 P1).
C. (P4 P2).
D. (P4 P3).
Suppose that, a country with a closed economy opens itself to international trade and becomes a net exporter. In that case, the price of that good will ________ when the economy goes from closed to open for trade.
A. decrease B. first decrease then increase C. increase D. stay the same