The graph shows
A) a relationship with a minimum.
B) a relationship with a maximum.
C) no relationshi
A
You might also like to view...
Refer to the figure below. Moving from demand curve D1 to demand curve D2 illustrates a(n):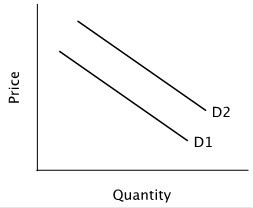
A. decrease in quantity demanded. B. increase in quantity demanded. C. increase in demand. D. decrease in demand.
A business incurs the following costs per unit: Labor - $5/unit; Materials $3/unit and rent - $5000/month. If the firm produces 100 . units a month, the total fixed costs equals
a. $5,000 b. $8,000 c. $13,000 d. $3,000
When the game does reach the Nash Equilibrium, the payoffs for both stores will be
a. Megastore $95 and Superstore $80 b. Megastore $305 and Superstore $55 c. Megastore $65 and Superstore $285 d. Megastore $165 and Superstore $115
When people prefer to obtain medical, or legal services from white males, although they charge high prices for their services, it is termed as:
a. producer prejudice. b. employer prejudice. c. worker prejudice. d. occupational segregation. e. consumer prejudice.