In the graph showing the data for the short-run and long-run Phillips curve from 1961–1973, the shift back to the natural rate of unemployment is represented by the move from ______.
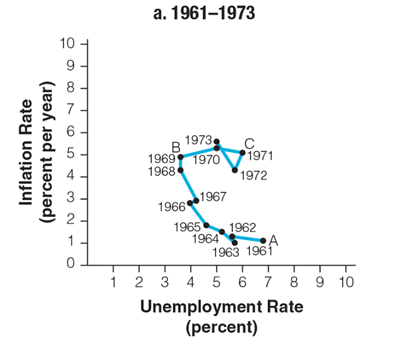
a. Point A to Point B
b. Point A to Point C
c. Point B to Point C
d. Point C to Point A
c. Point B to Point C
You might also like to view...
The natural rate of unemployment is the rate of unemployment that
A. is an unrealistic goal set by policymakers. B. occurs when employers find more than one job applicant for each job available. C. all workers and employers have fully adjusted to any changes in the economy. D. occurs when all workers find work in the economy.
The person least likely to receive a payment from a corporation in a year of losses is the
A) bank that loaned money to the corporation. B) bondholder. C) preferred stockholder. D) common stockholder.
Refer to the diagrams, in which AD 1 and AS 1 are the "before" curves and AD 2 and AS 2 are the "after" curves. Other things equal, a decrease in resource prices is depicted by:
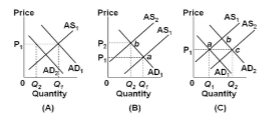
A. panel (A) only.
B. panel (B) only.
C. panel (C) only.
D. panels (B) and (C).
The price of oil falls.
Describe the effect on the AD curve, the SRAS curve, and the LRAS curve.