Refer to the information in Figure 16.5 below to answer the question(s) that follow.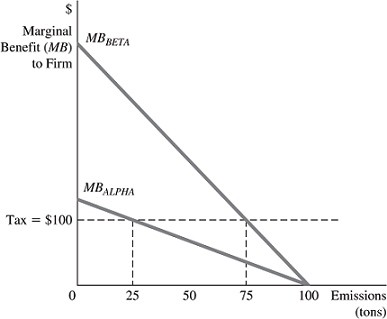 ?Figure 16.5Figure 16.5 shows the marginal benefits of emitting pollution for the only two chemical companies in an industry, Alpha Chemicals and Beta Chemicals. Before any tax on pollution emissions is imposed, each company views pollution as being free.Refer to Figure 16.5. Before any tax on pollution is imposed, Alpha Chemicals is emitting ________ tons of pollution.
A. 25
B. 50
C. 75
D. 100
Answer: D
You might also like to view...
In the above figure, what is the efficient quantity of pretzels to produce each day?
A) one hundred B) two hundred C) three hundred D) four hundred
How is the Solow residual measured? What problems arise in its measurement when resource utilization varies over the business cycle? What implications do these measurement issues have for evidence supporting the RBC model?
What will be an ideal response?
Suppose Julia and Zach are the only consumers of milk. Julia's demand for milk is defined as QdJulia = 12 - 3P at prices below $4 and zero for prices above $4. Zach's demand for milk is defined as QdZach = 10 - 2P at prices below $5 and zero for prices above $5. In this case, the market demand curve for milk is:
A. upward sloping. B. a downward sloping straight line. C. kinked at a quantity of 2 units. D. kinked at a quantity of 1 unit.
Refer to the information provided in Table 3.2 below to answer the question(s) that follow.Table 3.2Price per CheeseburgerQuantity Demanded (Cheeseburgers per Month)Quantity Supplied (Cheeseburgers per Month)$51,500 500 61,200 700 7 900 900 8 6001,100 9 3001,300Refer to Table 3.2. This market will be in equilibrium if the price per cheeseburger is
A. $5. B. $6. C. $7. D. $8.