Graph the equation by plotting points.y = x2 + 2
A. 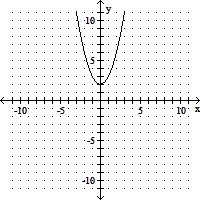
B. 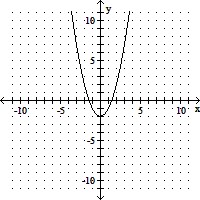
C. 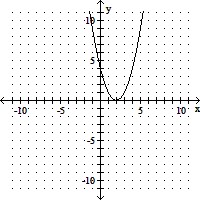
D. 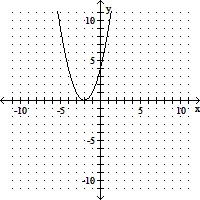
Answer: A
You might also like to view...
Use counting rules to determine the probability.Dave puts a collection of 15 books on a bookshelf in a random order. Among the books are 2 fiction and 13 nonfiction books. What is the probability that the 2 fiction books will be all together on the left side of the shelf and the 13 nonfiction all together on the right side of the shelf?
A. 0.01619 B. 0.01809 C. 0.01333 D. 0.00952
Determine which values of x and y, if any, are not permissible. f(x, y) = 
A. x ? 0 B. y ? -4 C. x ? 3 and x ? -3 D. All values of x and y are permissible.
Solve the problem.Determine the point on the plane  that is closest to the point
A. (-2, -1, -3) B. (2, 1, -3) C. (2, -1, 3) D. (-2, 1, -3)
The following double-bar graph illustrates the revenue for a company for the four quarters of the year for two different years. Use the graph to answer the question.  How much more revenue did the company take in for the fourth quarter of 2010 than the second quarter of 2009?
A. $7 million B. $35 million C. $6 million D. $30 million