Sketch the graph of the function over the interval 0 ? x ? 2?.y = cos 

A. 
B. 
C. 
D. 
Answer: C
You might also like to view...
Use the pictograph to answer the question.This pictograph shows projected sales of compact disks (CDs) for a popular rock band for seven consecutive years. 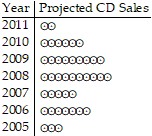 ? = 10,000 CDsBetween which two years was there the greatest decline in sales?
A. Between 2006 and 2007 B. Between 2007 and 2008 C. Between 2010 and 2011 D. Between 2009 and 2010
Multiply.8549
A. 72,666.5 B. 726.665 C. 712.132 D. 7266.65
Use the accompanying graph of y = f(x) to sketch the graph of the indicated function.y = -f(x)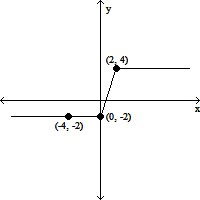
A. 
B. 
C. 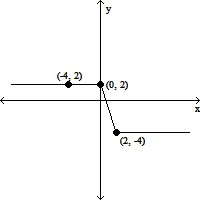
D. 
Use the graph to determine the domain and range of the function.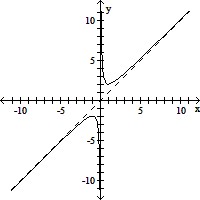
A. domain: {x|x ? 0} range: all real numbers B. domain: all real numbers range: {y|y ? -2 or y ? 2} C. domain: {x|x ? 0} range: {y|y ? -2 or y ? 2} D. domain: {x|x ? -2 or x ? 2} range: {y|y ? 0}