This graph shows what causes
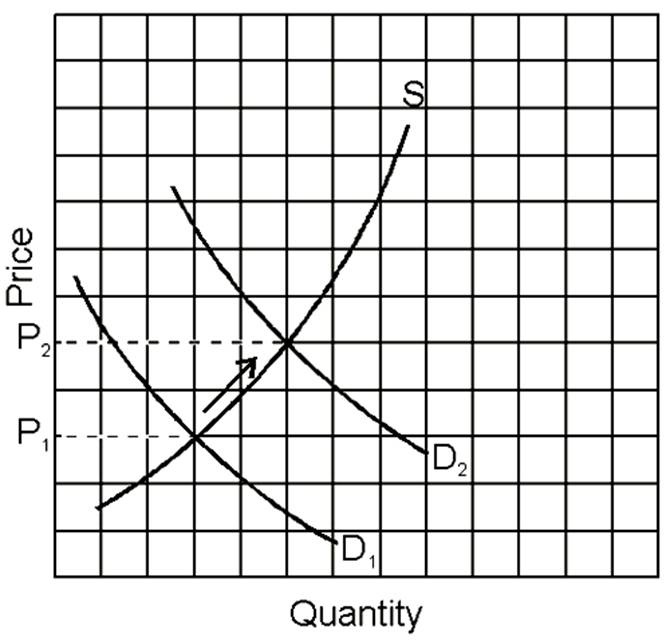
A. cost-push inflation.
B. demand-pull inflation.
C. neither cost-push nor demand-pull inflation.
B. demand-pull inflation.
You might also like to view...
When the price of raisins falls, the quantity of raisins demanded rises. Explain this change in terms of income and substitution effects
What will be an ideal response?
Consider a firm operating in a perfectly competitive market. At its current output of 200 units, marginal revenue is $25 . At this output, average total cost is decreasing and equals $22 . Given this information, what should the firm do? a. Continue to produce 200 units, because this maximizes profits
b. Increase output beyond 200 units, since a higher output will yield the profit maximizing output level. c. Decrease output below 200 units, since a lower output will result in the profit maximizing output level. d. More information is needed to determine the firm's next step.
Refer to the given information. Zippo has a:
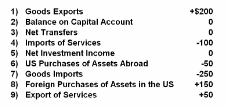
The plus items below are “export-type” entries and the minus items are “import-type” entries in the balance of payments for the hypothetical country of Zippo.
A. current account surplus.
B. financial account deficit.
C. financial account surplus.
D. surplus on goods and services.
What explanations have been offered to account for the Great Moderation?
What will be an ideal response?