Refer to Figure 1A.1. The slope of the line between the points where income equals 50 and income equals 200 is
A) 0.2. B) 5. C) 10. D) 50.
B
You might also like to view...
At the XYZ Co, a unit of capital costs three times as much as a unit of labor. If MPK = 10, MPL = 5, then this firm
A) is minimizing its cost at current output level. B) should use more capital and less labor to raise output at current cost. C) should use less capital and more labor to raise output at current cost. D) None of above.
A subsidy to buyers has been placed in the market in the graph shown. The result is:
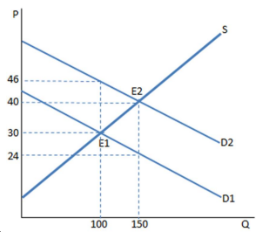
A. a higher quantity bought and sold at a higher price.
B. customers are worse off than before the subsidy.
C. producers are worse off than before the subsidy.
D. None of these is true.
A two-way network linking nine users creates how many potential network connections?
A. 72 B. 90 C. 56 D. 18
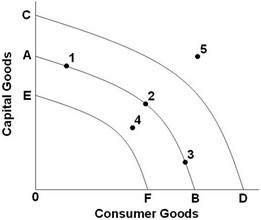 Refer to the above diagram. If there is a movement away from the full employment of resources in an economy with production possibilities curve AB, this can be shown by:
A. a movement from point 2 to point 4. B. a shift of the curve from AB to CD. C. point 5 in the diagram. D. a movement from point 3 to point 1.