Graph y = f(x). Compare the graph to the graph of y = log x.f(x) = 4 log x
A. Increases faster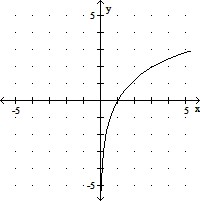
B. Increases faster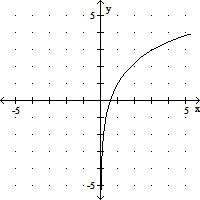
C. Reflected across the x-axis and
changes faster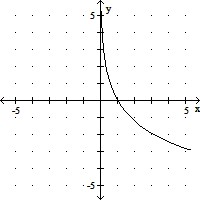
D. Decreases faster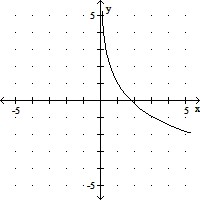
Answer: A
You might also like to view...
Factor.7x2 - 7x - 42
A. Prime B. 7(x + 2)(x - 3) C. 7(x - 2)(x + 3) D. (7x + 14)(x - 3)
Solve the problem.The graph depicts a relationship between scores achieved on an unspecified standardized test and family income. Suppose the score for a test is 485 when the family income is $25,000 and is 535 when the family income is $55,000. Let x be the income, in thousands, and y be the score of the test. Graph the two given pairs of incomes and scores. Assume that the relationship is linear. Draw a line though the two previous points. From your graph, estimates the score if the family income is $40,000. Label the axes, and show where the solution is located on the graph.
A. 
Standardized test score: 585
B. 
Standardized test score: 560
C. 
Standardized test score: 510
D. 
Standardized test score: 535
Use the given zero to find the remaining zeros of the function.f(x) = x3 - 2x2 - 11x + 52; zero: -4
A. 1 + 2i, 1 - 2i
B. 6 + 4i, 6 - 4i
C. 1 + 2 i, 1 - 2
 i
i
D. 3 + 2i, 3 - 2i
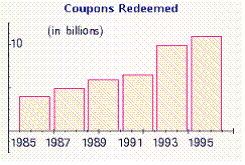
Which of the following illustrations is a pictograph? ?
A. 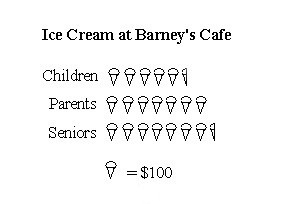
B. 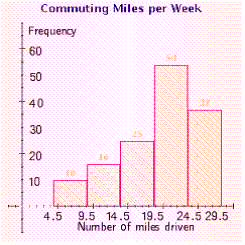
C. 
D. 
E.