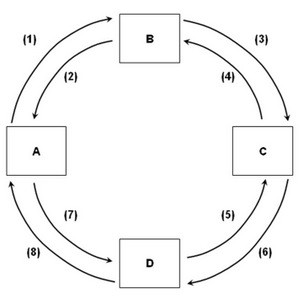
 Refer to the above figure. If box A represents businesses and box B represents the resource market in this circular flow model, then the real flow of goods, services, and economic resources would be represented by flows:
A. (5), (6), (7), and (8).
B. (7), (5), (4), and (2).
C. (1), (2), (3), and (4).
D. (1), (3), (6), and (8).
Answer: B
You might also like to view...
Within a fixed exchange rate system, the effect of an expansionary fiscal policy action on the balance of payments will be to
a. worsen the balance on the capital account but improve the trade balance. b. worsen the trade balance but improve the balance on the capital account. c. worsen both the trade balance and the balance on the capital account. d. improve both the trade balance and the balance on the capital account.
Should state taxes paid be deductible on federal taxes?
What will be an ideal response?
The nondiscriminating pure monopolist's demand curve:
A. is the industry demand curve. B. tends to be inelastic at high prices and elastic at low prices. C. is identical to its marginal revenue curve. D. shows a direct or positive relationship between price and quantity demanded.
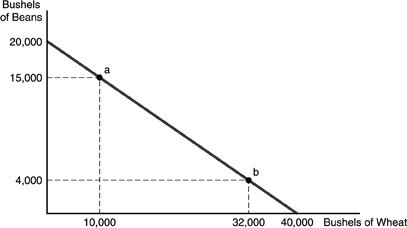 Refer to the above figure. A farmer has 50 acres of land on which to grow wheat or beans. An acre of land yields 400 bushels of beans or 800 bushels of wheat. Which of the following is a possible combination of beans and wheat that can be grown, assuming the land is farmed efficiently?
A. 25,000 bushels of beans and 25,000 bushels of wheat B. 15,000 bushels of beans and 10,000 bushels of wheat C. 30,000 bushels of each D. 20,000 bushels of beans and 40,000 bushels of wheat