A cost of aggregation is that:
A. broad economic trends are obscured
B. details about individual households and firms are lost
C. economy-wide totals cannot be obtained
D. the "big picture" cannot be studied
Answer: B
You might also like to view...
If the price of capital falls, _____
a. the supply of capital increases b. the quantity supplied of capital decreases c. the quantity supplied of capital increases d. the quantity supplied of capital remains unchanged e. the supply of capital decreases
Aggregate demand and supply curves have been widely used to analyze the performance of the macroeconomy. Figure 5-3 shows four diagrams that represent different changes in the macroeconomy. Choose the diagram that best represents the situations described in the following questions.Figure 5-3
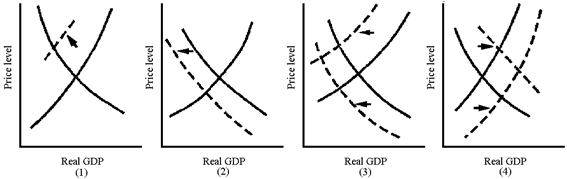 Which graph in Figure 5-3 best represents the supply-side shock of the 1970s oil crisis?
A. 1 B. 2 C. 3 D. 4
The Keynesian cause-and-effect sequence predicts that an increase in the money supply will cause interest rates to:
A. fall, boosting investment and shifting the AD curve rightward, leading to an increase in real GDP. B. fall, cutting investment and shifting the AD curve leftward, leading to a decrease in real GDP. C. rise, cutting investment and shifting the AD curve rightward, leading to an increase in real GDP. D. rise, boosting investment and shifting the AD curve rightward, leading to an increase in real GDP.
In moving along a given budget line:
A. the prices of both products and money income are assumed to be constant. B. each point on the line will be equally satisfactory to consumers. C. money income varies, but the prices of the two goods are constant. D. the prices of both products are assumed to vary, but money income is constant.