For this question, assume that taxes are independent of income (i.e., the income tax rate is zero). Now suppose that fiscal policy makers wish to decrease equilibrium output by $500 billion. Further suppose that policy makers can choose one of the following two options: (1 ) change in government spending; or (2 ) change in taxes. Compare and explain the relative size of the changes in government
spending and taxes needed to obtain this desired change in output.
What will be an ideal response?
The change in taxes will have to be larger because part of any tax increase will cause saving to fall. So, to cause the same reduction in demand, the size of the tax cut will have to be larger than the size of any reduction in government spending.
You might also like to view...
Use the following graphs to answer the next question.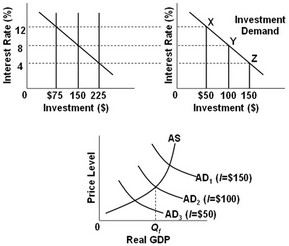 In the graphs, the numbers in parentheses near the AD1, AD2, and AD3 labels indicate the levels of investment spending associated with each curve. All figures are in billions. What is the desired level of investment spending in this economy if the goal is to achieve a noninflationary, full-employment level of real GDP?
A. $100 billion B. $225 billion C. $150 billion D. $50 billion
How would the following factors affect equilibrium in the market for labor?
a. An increase in the demand for the product that a firm is producing b. The use of a new technology that halves the time that workers will take to produce a good c. An increase in the age when people begin to receive Social Security benefits.
The majority of minimum wage workers are
A. middle aged. B. trying to support a family. C. young people who are not supporting families. D. older workers who are retired.
In a business cycle, a peak represents the end of ________ and a trough represents the end of ________.
A. a recession; an expansion B. a trough; a peak C. an expansion; a recession D. a depression; an expansion