When looking at a graph of nominal and real interest rates you notice the graph for nominal rates and the graph for real rates cross each other many times. From this you conclude
a. consumer prices sometimes rose and sometimes fell in the time frame represented on the graph.
b. consumer prices were always rising in the time frame represented on the graph.
c. the economy never experienced a recession in the time frame represented on the graph.
d. GDP was always increasing for the time frame represented on the graph.
a
You might also like to view...
One way of addressing the associated market failure that generates both private costs and external costs is for this activity to be
A) left alone. B) taxed. C) subsidized. D) banned.
The graph shown portrays a subsidy to buyers. The subsidy causes:
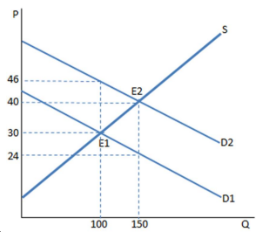
A. 50 more units to be sold in this market.
B. 150 more units to be sold in this market.
C. 100 fewer units to be sold in this market.
D. 50 fewer units to be sold in this market.
If you would have to pay $5,000 in taxes on a $25,000 taxable income and $7,000 on a $30,000 taxable income, then the marginal tax rate on the additional $5,000 of income is:
A. 40 percent and the average tax rate is about 23 percent at the $30,000 income level. B. 50 percent and the average tax rate is 40 percent at the $30,000 income level. C. 40 percent and the average tax rate is 25 percent at the $25,000 income level. D. 30 percent, but average tax rates cannot be determined from the information given.
Which of the following statements are true?
A) A bank's assets are its sources of funds. B) A bank's liabilities are its uses of funds. C) A bank's balance sheet shows that total assets equal total liabilities plus equity capital. D) A bank's balance sheet indicates whether or not the bank is profitable.