In the above figure, if D2 is the original demand curve and the population falls, which price and quantity might result?
A) point a, with price P2 and quantity Q2
B) point b, with price P1 and quantity Q1
C) point c, with price P3 and quantity Q3
D) point d, with price P1 and quantity Q3
B
You might also like to view...
During the decade of the 1920s, the distribution of income
(a) became increasingly equal. (b) changed little or not at all. (c) became increasingly unequal. (d) may or may not have changed, but it is difficult to know because of lack of data.
If the fiscal year begins without a budget and Congress fails to pass continuing resolution, then:
A. the president has the right to raise the debt ceiling. B. federal agencies operate on the basis of the previous year's budget. C. the interest rate paid on the national debt automatically increases. D. the federal government shuts down.
In the following figure, AB is the production-possibility curve of Canada. The line PQ shows the price ratio of one bushel of wheat/bale of cotton. The international price ratio is 0.25 bushels of wheat/bale of cotton as shown by the line RS. I1 and I2 are two of the community indifference curves of Canada. Which of the following can be inferred from this figure?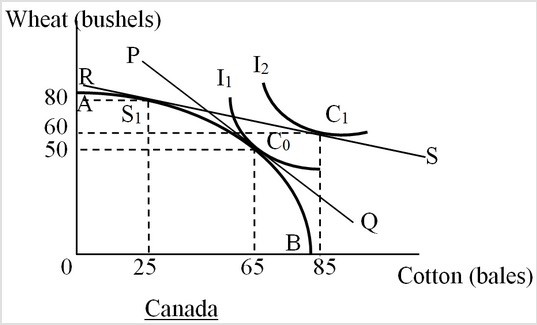
A. Canada has a comparative advantage in the production of wheat. B. Canada has an absolute advantage in the production of both goods. C. Canada has an absolute disadvantage in the production of both goods. D. Canada has a comparative advantage in the production of cotton.
Behavioral economists believe that people:
A. assess current and future options equally well. B. do not care about fairness, especially if it impairs their ability to get what they want. C. make errors in decision making because of problems such as bad information, but such errors are random and generally not repeated by the same individual. D. often succumb to temptation.