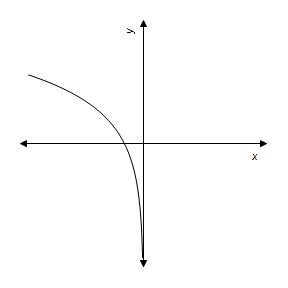
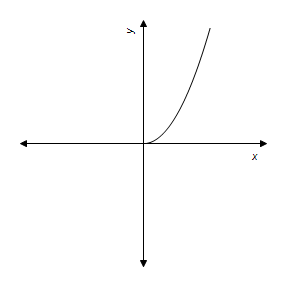
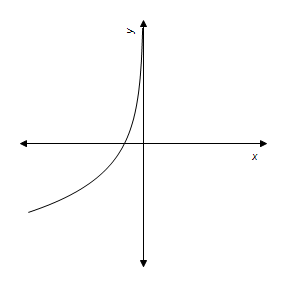
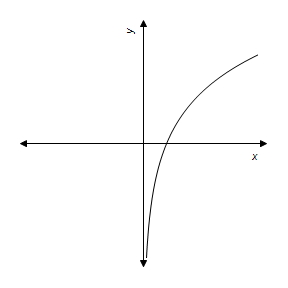
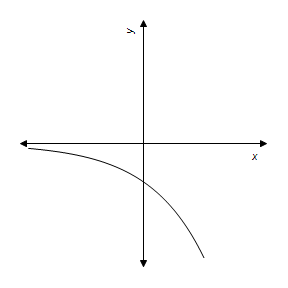
Which answer choice is a graph of the function?
?

?
A. ?
?
B. ?
?
C. ?
?
D. ?
?
E. ?
?
Answer: D
You might also like to view...
Use the pictograph to answer the question.For selected countries, this pictograph shows approximately how many kilograms of seafood are consumed by each person (per capita) annually.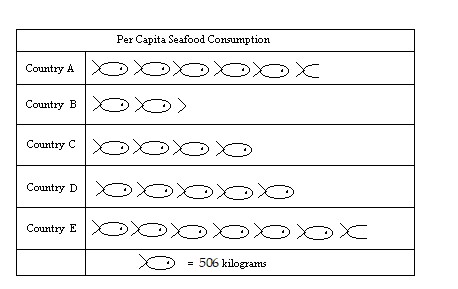 People in Country D eat approximately what percent more seafood than people in Country C?
A. 50% B. 25% C. 125% D. 75%
A hot, wet summer is causing a mosquito population explosion in a lake resort area. The number of mosquitoes is increasing at an estimated rate of 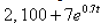 per week (where t is measured in weeks). By how much does the mosquito population increase between the 4th and 6th weeks of summer?
What will be an ideal response?
Determine the domain of the function.f(x) = 3 - 5
A. [-3, ?) B. (-?, ?) C. [3, ?) D. (-?, -3)
Multiply the polynomials using the FOIL method. Express the answer as a single polynomial in standard form.(x + 4)(x + 3)
A. x2 + 7x + 12 B. x2 + 12x + 7 C. x2 + 7x + 7 D. x2 + 6x + 12