Refer to the diagram. Total utility:
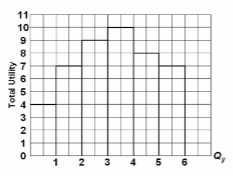
A. increases so long as additional units of Y are purchased.
B. becomes negative at 4 units.
C. increases at a diminishing rate, reaches a maximum, and then declines.
D. is maximized at 2 units.
C. increases at a diminishing rate, reaches a maximum, and then declines.
You might also like to view...
The table below shows data regarding Germany's labor market
Year Labor Force (millions) Number of Employed (millions) Population (millions) 2006 43.7 39.01 82.3 2007 43.7 39.06 82.2 2008 43.6 39.8 82.1 The data show that Germany's unemployment rate between 2007 and 2008 A) increased. B) decreased C) stayed the same. D) cannot be determined because the population decreased.
Suppose the demand for Pepsi-Cola is qp = 54 – 2pp + 1pc. The demand for Coca-Cola is qc = 54 - 2pc + 1pp. Each firm faces a constant marginal cost of zero. Determine the Bertrand equilibrium prices
What happens to the Bertrand equilibrium prices and profits if increased differentiation causes the demand for Pepsi-Cola to become qp = 104 - 2pp + 1pc while the demand for Coca-Cola remains unchanged?
If real GDP grows at a constant rate of 2 percent per year, using the "rule of 72" it will take approximately ___ years for real GDP to double
a. 15 b. 20 c. 10 d. 36
Using Figure 1 above, if the aggregate demand curve shifts from AD1 to AD2 the result in the long run would be: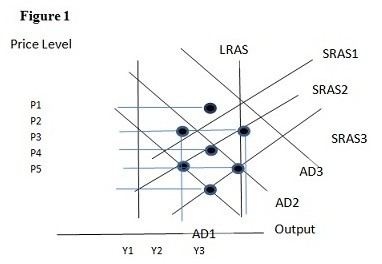
A. P1 and Y2. B. P2 and Y2. C. P3 and Y1. D. P2 and Y3.