Construct a graph for the first ten terms of the sequence.The first five terms of the sequence are 4, 3.25, 2.5, 1.75, 1.
A. 
B. 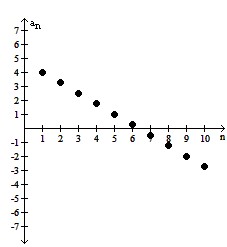
C. 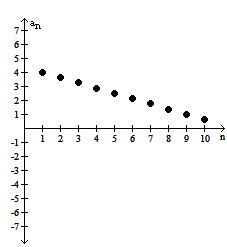
D. 
Answer: B
You might also like to view...
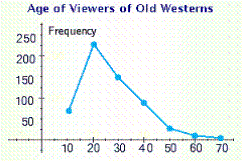
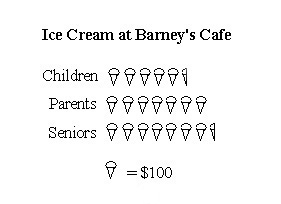
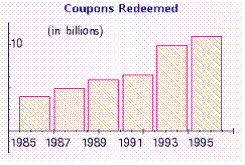
Which of the following illustrations best represents a bar graph?
A.

B.

C.
D.
E.
The following table shows the value V, in dollars, of a stamp collection after t years. t 0 1 2 3 V $323.00 $345.61 $369.80 $395.69? A: Make a table of successive ratios to show that the value of the stamp collection can be modeled by an exponential function. Round your answer to two decimal places.B: Find an exponential model for the data. Round your answer to two decimal places.C: Plot the graph of the data points along with the exponential model. Include up to 10 years.D: According to the model, what is the percentage increase in the value of the collection over a 4.00-year period? Round your answer to two decimal places.
What will be an ideal response?
Use a graphing calculator to solve the system of equations. Round your solutions to one decimal place.2.3x - 0.5y - 3.2z = -4.94.9x - 7.0y - 0.3z = -5.02.5x + 0.7y - 4.5z = 0.3
A. (29.7, 20.7, 19.7) B. (119.0, 82.8, 78.7) C. (238.0, 165.6, 157.4) D. (59.5, 41.4, 39.4)
Solve the problem.Some of the results of an analysis, on the makeup of garbage, are given in the following table. The table displays various years which gives the number of pounds per person per day of various types of waste materials. For plastics, calculate the average rates of change between consecutive data points in the table. Interpret the meaning of your results.
A. The rate of increase increases during the 1990's, but then decreases during the 2000-2008. B. The rate of increase decreases from each decade to the next. C. The rate of increase decreases during the 1990's, but then increases during 2000-2008. D. The rate of increase increases from each decade to the next.