Multiply.9 ? 5 ? 0 ? 7
A. 30
B. 315
C. 324
D. 0
Answer: D
Mathematics
You might also like to view...
Provide an appropriate response.Suppose that you want to construct a graph to represent the following data. 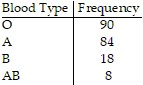 If you are primarily interested in the number of people in each category as a percentage of the total number of people, would a bar chart or a pie chart be more useful? Explain your thinking.
What will be an ideal response?
Mathematics
Find the quotient. Assume all variables have positive values. Leave your answer in simplest form.
A. 20Q5
B. 20Q2
C. 20Q3
D. 5Q2
Mathematics
Find the exact value of the expression.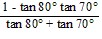
A. 
B. 
C. - 
D. - 
Mathematics
Simplify the expression. Write the result using positive exponents only.
A. 
B. 
C. 
D. 
Mathematics