In a diagram showing the average total cost and average variable cost curves, the minimum point of the average total cost is
A) at the same level of output as the maximum of the total product curve.
B) at a lower level of output than the minimum point of the average variable cost.
C) at a larger level of output than the minimum point of the average variable cost.
D) at the same level of output as the minimum point of the average variable cost.
C
You might also like to view...
How is the dividing line between poverty and nonpoverty measured? Does this method overstate the degree of poverty?
For international trade to benefit a country, it must benefit all citizens of that country
a. True b. False Indicate whether the statement is true or false
Last year, Jane spent all of her income to purchase 200 units of corn at $5 per unit. This year, she spent all of her income to purchase 180 units of corn at $6 per unit
a. Jane's nominal income and real income decreased this year. b. Jane's nominal income decreased this year, but her real income increased. c. Jane's nominal income and real income increased this year. d. Jane's nominal income increased this year, but her real income decreased.
Using Figure 48.1, modeling the attacks of September 11, 2001, you would show the aggregate supply shock by using 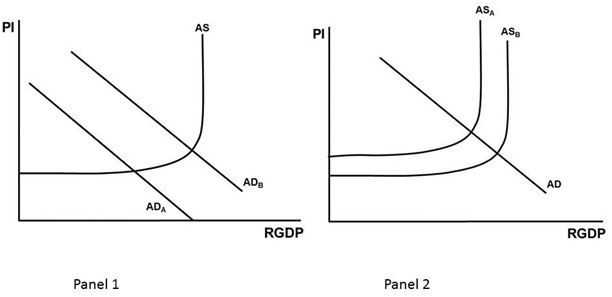 Figure 48.1
A. Panel 1 only with a shift from ADA to ADB. B. Panel 2 only with a shift from ASB to ASA. C. Panel 1 only with a shift from ADB to ADA. D. Panel 1 to model the aggregate demand shock (ADB to ADA) and Panel 2 to model the aggregate supply shock (ASB to ASA).