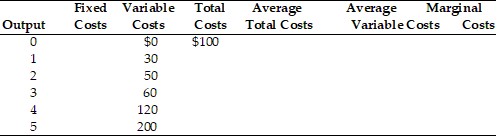
 In the above table, what is the marginal cost to produce the 2nd unit of output?
A. $55
B. $20
C. $30
D. $60
Answer: B
You might also like to view...
In the graph showing the Phillips curve after a negative supply shock, we can see that high energy prices in the late 1970s caused ______.
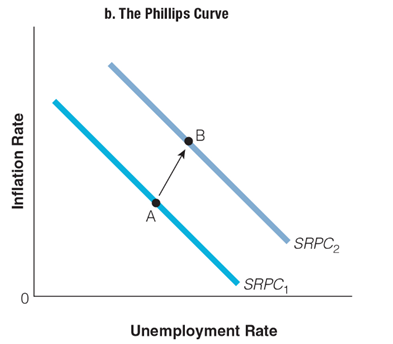
a. an increase in inflation rate and a decrease in unemployment rate
b. a decrease in inflation rate and an increase in unemployment rate
c. an increase in both inflation and unemployment rates
d. a decrease in both inflation and unemployment rates
Assume individuals consider only the medium run effects of changes in future macro variables when forming expectations of future output and future interest rates. Suppose current taxes are cut AND that individuals expect future taxes to decrease. Given this information, we know with certainty that
A) current output and the current interest rate will both increase. B) current output will increase. C) the current interest rate will increase. D) the expected future interest rate will increase.
Which of the following is a barrier to economic growth in many developing nations?
A. the lack of natural resources B. the lack of economic freedom C. the low level of restrictions in the labor market D. the shortage of labor
Refer to the information provided in Figure 26.5 below to answer the question(s) that follow.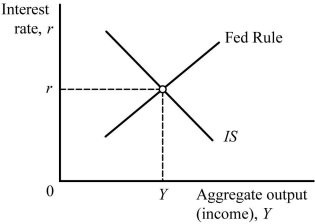 Figure 26.5Refer to Figure 26.5. As a result of ________, the equilibrium interest rate increases and the equilibrium output level increases.
A. a decrease in the price level B. a decrease in government spending C. an increase in the price level D. an increase in government spending