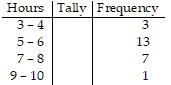
Use the data to make a frequency distribution table.Kevin asked some of his friends how many hours they worked during the previous week at their after-school jobs. Frequency Distribution Table
What will be an ideal response?
Frequency Distribution Table
Mathematics
You might also like to view...
Simplify.50
A. 1 B. 5 C. -1 D. 0
Mathematics
Indicate whether the function is one-to-one.C = {(6, 3), (9, 4), (7, 5), (5, 6)}
A. Yes B. No
Mathematics
Use the graph to solve the problem.In one city, the temperature in Fahrenheit on a typical summer day can be approximated by the following function:
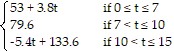 Here, t represents the number of hours since
  The graph of this function is shown below. At what time does it start to get cooler?
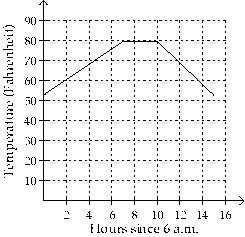
A. At 3 p.m. B. At 1 p.m. C. At 10 a.m. D. At 4 p.m.
Mathematics
Evaluate the integral.
?
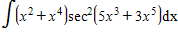 ?
Use the symbol C to write the constant.
?
Use the symbol C to write the constant.
What will be an ideal response?
Mathematics