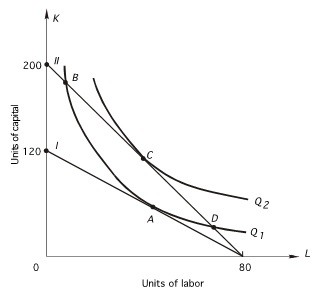
 In the above graph, the shift from I to II was due to
A. an increase in the price of labor.
B. a decrease in the price of capital.
C. a decrease in the price of labor.
D. an increase in the price of capital.
E. an increase in total cost.
Answer: B
You might also like to view...
How is the average product of labor calculated?
What will be an ideal response?
Refer to Scenario 10.9. At the profit maximizing level of output, what is the deadweight loss?
A) 0 B) 450 C) 900 D) 1,800 E) none of the above
When the amount supplied is greater at each price, there is a(n)
A) rightward shift in the supply curve. B) leftward shift in the supply curve. C) upward movement along the supply curve. D) downward movement along the supply curve.
As price decreases and we move down further along a linear demand curve, the price elasticity of demand will:
a. decrease. b. increase. c. stay the same. d. approach infinity. e. increase or decrease.