A graph that shows all the equally preferred combinations of two goods is called a(n)
a. demand curve
b. supply curve
c. consumer surplus curve
d. equalization curve
e. indifference curve
E
You might also like to view...
Starting from a long-run equilibrium, an increase in potential output leads to ________ gap in the short run and to ________ rates of inflation in the long run.
A. a recessionary; lower B. an expansionary; lower C. an expansionary; higher D. a recessionary; higher
According to the graph shown, if a firm is producing at Q2:
This graph represents the cost and revenue curves of a firm in a perfectly competitive market.
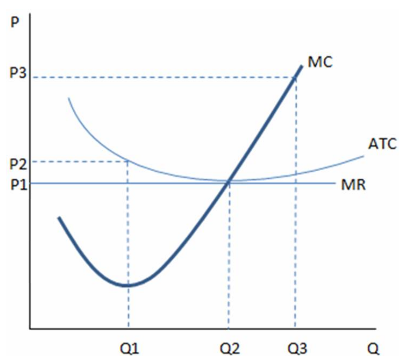
A. profits are being maximized.
B. average total costs are minimized.
C. it is producing at an efficient scale.
D. All of these are true.
Whenever the price of Good A increases, the demand for Good B increases as well. Good A and B appear to be: a. complements. b. substitutes
c. inferior goods. d. normal goods.
Give some possible explanations of the productivity slowdown in the United States that occurred in the 1973–1995 period.
What will be an ideal response?