Graph the function.f(x) = 4
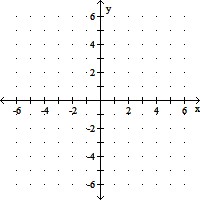
A. 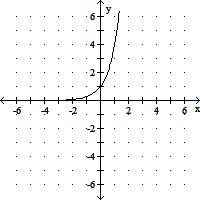
B. 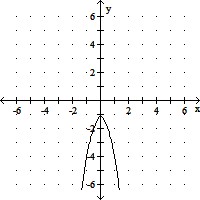
C. 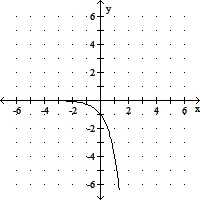
D. 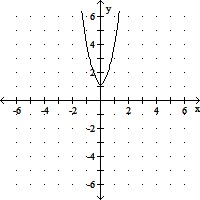
Answer: D
You might also like to view...
Create a graphical display for the data given. You may choose any graphic type that you feel is appropriate. Write a few sentences explaining why you chose this type of display and a few sentences describing any interesting patterns in the data.The table below shows statistics for AIDS. The first column shows the estimated number of people living with HIV/AIDS worldwide in various years. The second column shows the estimated number of new HIV infections worldwide in various years. 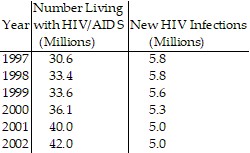
What will be an ideal response?
Find the second derivative.s =  + 5
+ 5
A. 5t2 B. 10t + 5 C. 5t D. 10t
Find the area of the shaded region of the figure. Use 3.14 for ? as necessary.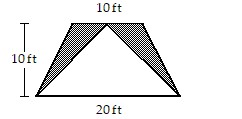
A. 50 ft2 B. 10 ft2 C. 100 ft2 D. 20 ft2
Evaluate the integral.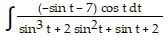
A. -ln +
+  ln
ln - 3 tan-1(sin t) + C
B. -ln +
+  ln
ln - 3 tan-1 t + C
C. -ln +
+  ln
ln + C
+ C
D. ln - ln
- ln - 5 tan-1(sin t) + C