Refer to the diagram, in which S 1 and D 1 represent the original supply and demand curves and S 2 and D 2 the new curves. In this market the indicated shift in demand may have been caused by:
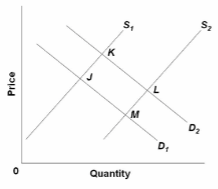
A. a decline in the number of buyers in the market.
B. a decline in the price of a substitute good.
C. an increase in incomes if the product is a normal good.
D. an increase in incomes if the product is an inferior good.
C. an increase in incomes if the product is a normal good.
You might also like to view...
In November, 2012, U.S. lawmakers were faced with a "fiscal cliff:" if they did not agree on how to reduce the federal deficit, automatic tax increases and drastic cuts in government spending would take effect
What would happen if the fiscal cliff occurred? A) The aggregate demand curve shifts leftward, the price level falls and real GDP decreases. B) The aggregate demand curve shifts rightward, the price level rises and real GDP increases. C) The short run aggregate supply curve shift leftward, the price level rises and real GDP decreases. D) The short run aggregate supply curve shifts rightward, the price level falls and real GDP increases.
According to the Hotelling Principle, the price of an nonrenewable resource
A) falls slowly over time. B) falls at a rate equal to the interest rate. C) rises at a rate equal to the interest rate. D) remains constant over time.
Which of the following program(s) is (are) in-kind assistance to fight poverty in the United States?
a. b and e. b. Medicaid. c. Unemployment benefits. d. Temporary Assistance to Needy Families (TANF). e. SNAP (food stamps).
The demand for good X is estimated to be Qxd = 10,000 ? 4PX + 5PY + 2M + AX where PX is the price of X, PY is the price of good Y, M is income, and AX is the amount of advertising on X. Suppose the present price of good X is $50, PY = $100, M = $25,000, and AX = 1,000 units. What is the quantity demanded of good X?
A. 61,300 ? 4PX B. 61,500 C. 61,500 ? 4PX D. 61,300