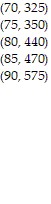
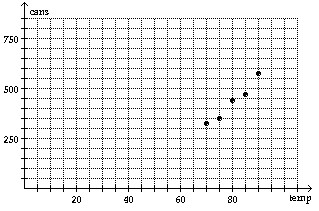
Provide an appropriate response.The table shows the number of cans of soda sold at a campus stand on five days with different high temperatures for the day. Write each paired data as an order pair of the form  Then create a scatter diagram of the ordered pairs. Do the paired data show a trend. If so, what is the trend?
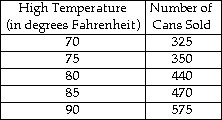
What will be an ideal response?
 ? ? |  |
You might also like to view...
Use problem solving strategies to solve the problem.Michael is thinking of a number. Twice the number increased by 5 is 19 less than four times the number. What is the number?
A. 29 B. 5 C. 12 D. 17
Provide an appropriate response.Find the domain of f(x) = 
A. {x|x ? -8} B. {x|x ? 8} C. {x|x is any real number} D. {x|x ? 11}
Solve the problem. Round rates to the nearest tenth of a percent and dollar amounts to the nearest cent.A local dealer sells baseballs for $25.00 each. If this is a 63.2% markup on cost, find the equivalent markup percent on the selling price.
A. 61.3% B. 38.7% C. 72.8% D. 63.2%
Find the zeros of the polynomial function and state the multiplicity of each.f(x) = x4 - 25x2 + 144
A. x = 16, multiplicity 2; x = 3, multiplicity 1 B. x = 16, multiplicity 2; x = 9, multiplicity 2 C. x = 16, multiplicity 1; x = 9, multiplicity 1 D. x = -4, multiplicity 1; x = 4, multiplicity 1; x = -3, multiplicity 1; x = 3, multiplicity 1