Complete the following:(a) Use the Leading Coefficient Test to determine the graph's end behavior.(b) Find the x-intercepts. State whether the graph crosses the x-axis or touches the x-axis and turns around at each intercept.(c) Find the y-intercept.(d) Graph the function.f(x) = (x + 2)(x - 3)2
What will be an ideal response?
(a) falls to the left and rises to the right
(b) x-intercepts: (3, 0), touches x-axis and turns; (-2, 0), crosses x-axis
(c) y-intercept: (0, 18)
(d) 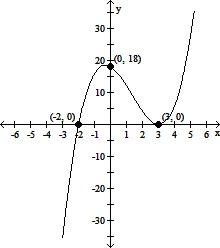
Mathematics
You might also like to view...
The following table shows the population N of a small town t years after 2000. Use linear regression to model the population as a function of years since 2000. t 2 3 6 7 N 2852 3038 3703 3982
What will be an ideal response?
Mathematics
Graph. Note that the equation is not in standard form.y = -1 - x
A. 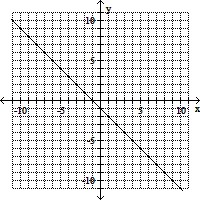
B. 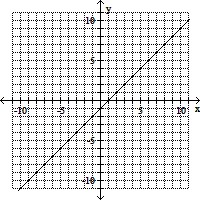
C. 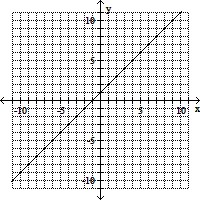
D. 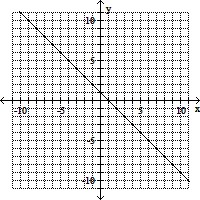
Mathematics
Evaluate. Round your result to the fourth decimal place.log23(305)
A. 0.5481 B. 3.8460 C. 1.8244 D. 1.1226
Mathematics
Evaluate the determinant.
?

Fill in the blank(s) with the appropriate word(s).
Mathematics