Which of the following illustrations represents a circle graph?
?
A. 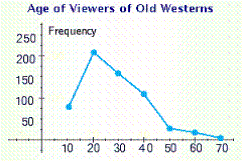
B. 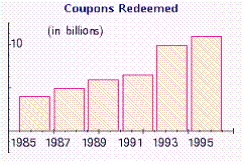
C. 
D. 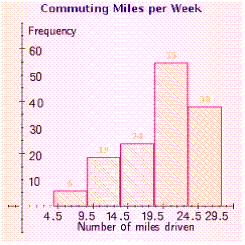
E. 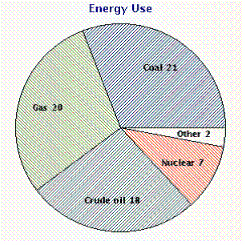
Answer: E
You might also like to view...
Write the sample space for the experiment. Two questions are answered on a questionnaire, the first identifying gender as male or female and the second identifying marital status as single, married, divorced, or widowed.
A. S = {(male, single), (male, married), (male, divorced),(female, married), (female, divorced), 
B. S = {(male, female), (single, married, divorced,widowed)}
C. S = {male, female, single, married, divorced, widowed}
D. S = {(male, single), (male, married), (male, divorced), (male, widowed), (female, single),  (female, divorced), (female, widowed)}
Divide. Write with positive exponents.
A. -2 - 18x6
B. 6x9 + 
C. -2 + 
D. -2 + 6x3
Graph the function.y = 2 cot 
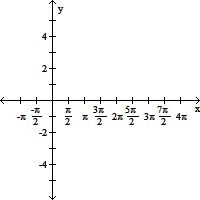
A. 
B. 
C. 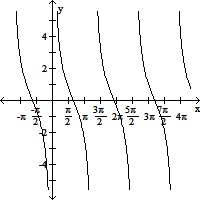
D. 
Find the equation for the line described.the line through (5, 2) and (-2, 2)
Fill in the blank(s) with the appropriate word(s).