Which one of the following is not one of the four major, day-to-day responsibilities of the CML?
A) identify (speciate) pathogens
B) isolate pathogens from clinical specimens
C) perform antimicrobial susceptibility testing when appropriate
D) process environmental samples
D) process environmental samples
You might also like to view...
Researchers tested nitrogen loss from soil where the moss Dawsonia was growing, and compared it to soil from which Dawsonia had been removed. The data are presented below
Researchers decided to test the hypothesis that if the 1-meter-tall Dawsonia gametophyte-sporophyte plants had acted as a physical buffer, then they would have reduced water's ability to erode the soil and carry away its nitrogen. They began with four equal-sized areas where Dawsonia mosses grew to a height of 1 m above the soil surface. One of the four areas was not modified. In the second area, the mosses were trimmed to a height of 0.5 m above the soil surface. In the third area, the mosses were trimmed to a height of 0.25 m above the soil surface. In the fourth area, the mosses were trimmed all the way to the ground, leaving only the rhizoids. Water, simulating rainfall, was then added in a controlled fashion to all plots over the course of one year. The figure below presents four graphs that depict potential results of this experiment. In the figure above, which graph of soil nitrogen loss over time most strongly supports the hypothesis that if the 1-m tall Dawsonia gametophyte-sporophyte plants had acted as a physical buffer, then they would have reduced water's ability to erode the soil and carry away its nitrogen? A) A B) B C) C D) D E) None of these graphs support the hypothesis.
Proteins that prevent inappropriate folding of newly synthesized proteins are called ____
Answer for this statement?
Which kind of ground tissue, A, B, or C, would be best described as soft tissue most responsible for storage or photosynthesis?
1.A
2.B
3.C
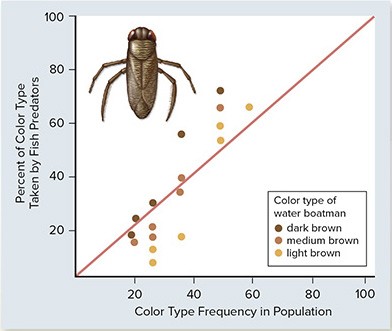 The percentage of different colored water boatmen (an aquatic insect) eaten by fish were graphed relative to the frequency of that color in different populations. Based on the graph, what conclusion can you draw?
A. Rare phenotypes will survive better due to positive-frequency selection. B. Common phenotypes will survive better due to negative-frequency selection. C. Common phenotypes will survive better due to positive-frequency selection. D. Rare phenotypes will survive better due to negative-frequency selection.