Refer to the following graph.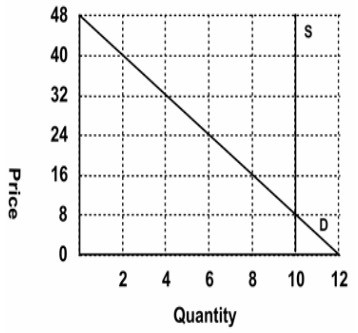 Which of the following pairs of equations describes the supply and demand curves?
A. Qs = P; Qd = 0.25P + 22, respectively
B. Qs = 10; Qd = 48 ? 2P, respectively
C. Qs = 10; Qd = 12 ? 0.25P, respectively
D. Cannot be determined
Answer: C
You might also like to view...
In 2008, real GDP in the United States was $13,312 billion. In 2009, real GDP in the United States was $13,112 billion. What was the U.S. economic growth rate from 2008 to 2009?
A) -1.5 percent B) 1.5 percent C) 0.98 percent D) 0.12 percent E) $200 million
What are the obstacles to achieving an efficient allocation of resources in the market economy?
What will be an ideal response?
Which of the following is a condition that helps enforce a cartel agreement?
A) a large number of firms B) relatively differentiated products C) easily observable prices D) large variation in prices
Which of the following might increase the supply curve of labor?
a. Easing licensing requirements. b. Elimination of discrimination against blacks. c. All of the answers are correct. d. Elimination of discrimination against females.