If a perfectly competitive firm has economic profits greater than zero, then we know that
A) the firm's industry is not in long-run equilibrium.
B) the firm's industry is in long-run equilibrium.
C) the firm is producing at the bottom of the average total cost curve.
D) the firm will reduce output.
Answer: A
You might also like to view...
Suppose the marginal propensity to consume is 0.75. What does this mean? What do we know about the marginal propensity to save? What do we know about the average propensity to consume?
What will be an ideal response?
On the surface, Usury laws are designed to protect consumers from exorbitant interest rates.
Answer the following statement true (T) or false (F)
Deborah has 80 hours per week to devote to working or to leisure. She is paid an hourly wage and can work at her job as many hours a week as she likes.
The following graph illustrates Deborah's weekly income-leisure tradeoff. The three lines labeled BC1BC1, BC2BC2, and BC3BC3 illustrate her time allocation budget at three different wages; points A, B, and C show her optimal time allocation choices along each of these constraints.
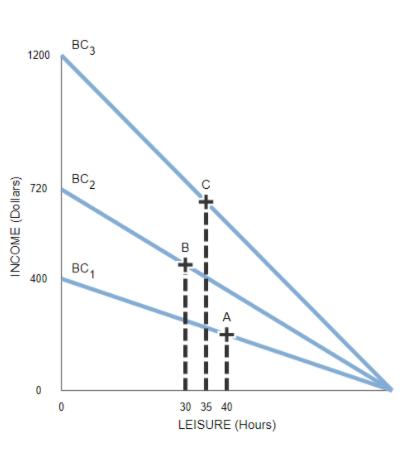
For each of the points listed, use the preceding graph to complete the following table by indicating the hourly wage at each point and how many hours per week Deborah will spend during leisure activities versus working.
| Point | Wage | Leisure | Labor |
|---|---|---|---|
| (Dollars per hour) | (Hours) | (Hours) | |
| A | |||
| B | |||
| C |
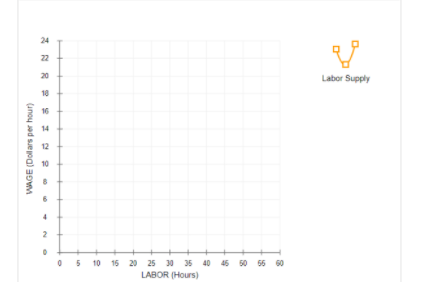
Based on the data you entered in the preceding table, use the orange curve (square symbols) to plot Deborah's labor supply curve on the following graph, showing how much labor she supplies each week at each of the three wages.
Suppose that Deborah's initial budget line was BC1BC1 and that it then changed to BC2
BC2; therefore, Deborah's optimal time allocation choice shifted from A to B. As a result of this change, Deborah's opportunity cost of leisure (decreased/increased) , and she chose to consume (less/more) leisure. Consequently, in this region, the (income/substitution) effect dominates the (income/substitution) effect. The corresponding portion of Deborah's labor supply curve is (upward sloping/downward sloping) .
The recession of 2007-2009 decreased the demand for imports in Japan, which caused the ________ curve for the yen to shift to the ________, increasing the exchange rate and the value of the yen
A) supply; right B) supply; left C) demand; right D) demand; left