Graph the function.Use the graph of f(x) = ex to obtain the graph of g(x) = -ex.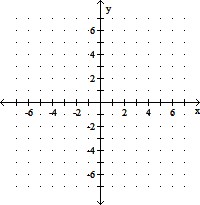
A. 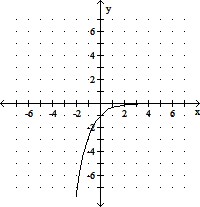
B. 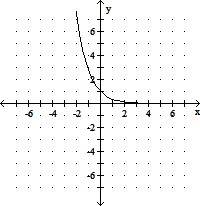
C. 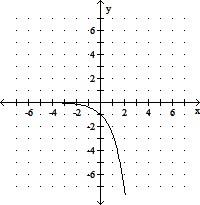
D. 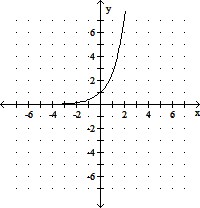
Answer: C
You might also like to view...
The circle graph shows the results of the student council presidential election. The complete circular area represents 100% of the votes. The circle graph shows what percent of the vote each person received.How many votes did Ann get?
A. 144 B. 132 C. 216 D. 108
Solve the equation. Give an exact solution.ln(5x - 2) = ln 12 - ln(x - 6)
A. no solution
B. 6, 
C. 
D. 0, 
Solve the problem.The function f models the population of Country X from 1991 to 1998. The graphs of f and the horizontal line y = 115 are shown in the figure. Use the graphs to determine the x-values that satisfy (i) the inequality  and (ii)
  Express your answers symbolically.
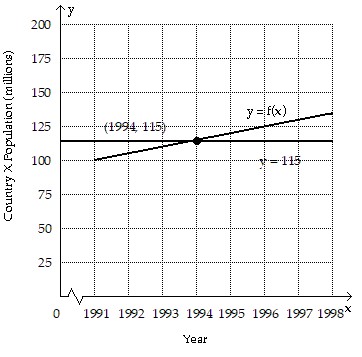
A. {x|x > 1994}; {x|x ? 1994} B. {x|x = 1994}; {x|x ? 1994} C. {x|x ? 1994}; {x|x > 1994} D. {x|x = 1994}; {x|x > 1994}
Multiply.(-19.3)(-3.80)
A. 0.7334 B. 733.4 C. 73.34 D. 7.334