Determine the quartiles as specified.The test scores of 19 students are listed below. Find the third quartile.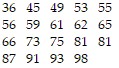
A. 81.00
B. 81
C. 15
D. 81.0
Answer: D
You might also like to view...
Graph the function as a solid curve and its inverse as a dashed curve.f(x) = 4x 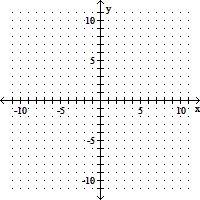
A. 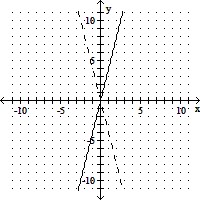
B. 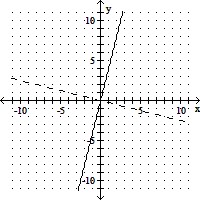
C. 
D. 
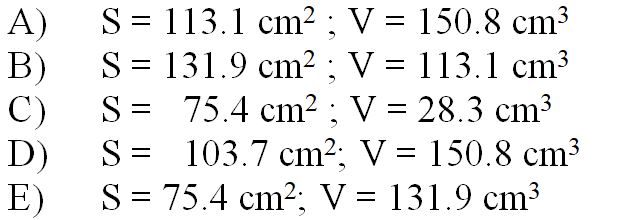
What are the surface area S and volume V of a cylinder with radius 3 cm and height 4 cm?
Use  from a calculator. Choices are rounded to the nearest tenth.
Solve the problem.The following data represents the average percent of possible sunshine for a certain city in Indiana. 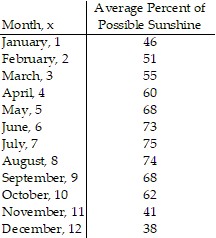 Draw a scatter diagram of the data for one period. Find the sinusoidal function of the form
 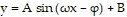 that fits the data. Draw the sinusoidal function on the scatter diagram. Use a graphing utility to find the sinusoidal function of best fit. Draw the sinusoidal function of best fit on the scatter diagram.
What will be an ideal response?
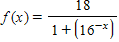
Find the logistic function f with the given properties. f has limiting value 18 and passes through (0, 9) and (1, 16). ?
A. 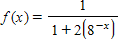
B. ?
C. ?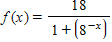
D. ?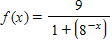
E. ?