Exhibit 5-8 GDP data (billions of dollars)
Personal consumption expenditures$850
Interest90
Corporate profits150
Government spending400
Depreciation100
Rental income70
Gross private domestic investment120
Compensation of employees830
Exports120
Imports70
Indirect business taxes80
Proprietors' income120
Personal income taxes110
Social Security taxes50
Transfer payments160
In Exhibit 5-8, national income (NI) equals:
A. $2,330 billion.
B. $1,350 billion.
C. $1,320 billion.
D. $2,360 billion.
Answer: C
You might also like to view...
It is impossible to figure out the "true" or "final" cost of getting an education at public schools because
A) no one has an incentive to keep accurate figures. B) an education at any public school is in most, if not all cases, a free good. C) an education is necessary. D) things in themselves have no cost.
Which of the following is NOT statistically correlated with higher economic growth rates?
A) higher rates of private investment spending B) higher rates of government investment spending C) greater political stability D) higher fertility rates E) higher school enrollment rates
Use the following graph for a competitive market to answer the question below.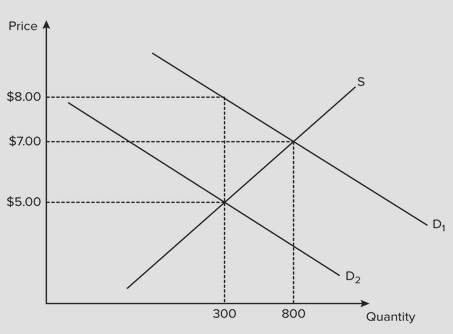 Assume the government imposes a $3 tax on buyers, which results in a shift of the demand curve from D1 to D2. The amount of the tax revenue paid by the seller is
A. $600. B. $300. C. $2100. D. $900.
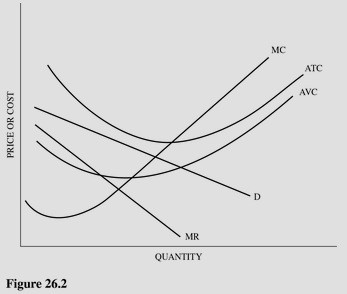 Refer to Figure 26.2 for a monopolistically competitive firm. At the profit-maximizing output and price, this firm is experiencing economic
A. Profits and should stay in this market in the long run. B. Profits but could make even higher economic profits producing the next best alternative good. C. Losses and should shut down in the short run. D. Losses but should keep producing in the short run.